Our Trading Methodology
At Ultheron, our trading approach is built on a foundation of proven technical analysis methods, disciplined risk management, and systematic execution. We combine Elliott Wave Theory, Fibonacci analysis, and strict risk controls to identify high-probability trading opportunities while protecting capital.
Elliott Wave Theory
Elliott Wave Theory is the cornerstone of our market analysis. Developed by Ralph Nelson Elliott in the 1930s, this principle recognizes that financial markets move in repetitive patterns driven by investor psychology and crowd behavior.
Understanding Wave Structure
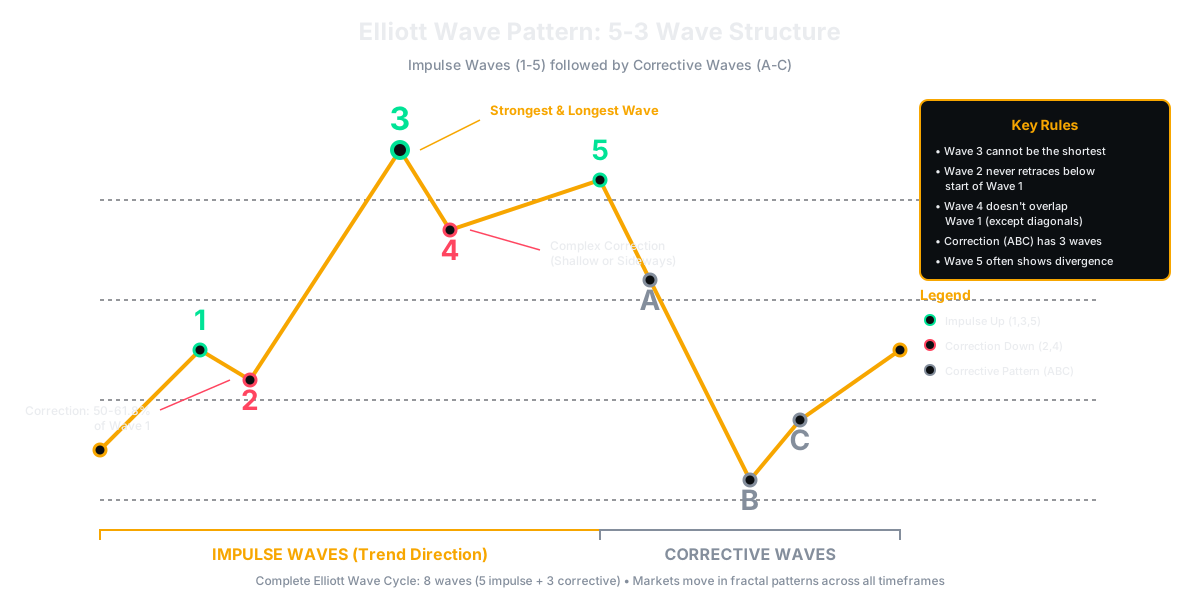
Markets move in a five-wave pattern in the direction of the main trend (impulse waves), followed by a three-wave corrective pattern. This creates a complete cycle of eight waves:
Impulse Waves (1-2-3-4-5)
- Wave 1: Initial move, often driven by early adopters or smart money
- Wave 2: Corrective pullback, typically retracing 50-61.8% of Wave 1
- Wave 3: Strongest and longest wave, driven by momentum and broad participation
- Wave 4: Complex correction, often sideways or shallow
- Wave 5: Final push, often with diverging momentum indicators
Corrective Waves (A-B-C)
- Wave A: Initial counter-trend move
- Wave B: Partial retracement of Wave A
- Wave C: Final decline, often equals Wave A in length
How We Apply Elliott Wave
We use Elliott Wave analysis to:
- Identify trend direction and strength: Determine whether we're in an impulsive or corrective phase
- Time entries: Enter during Wave 2 or Wave 4 corrections for optimal risk/reward
- Set price targets: Project where Wave 3 or Wave 5 is likely to complete
- Avoid late entries: Exit or reduce exposure as Wave 5 approaches completion
Fibonacci Analysis
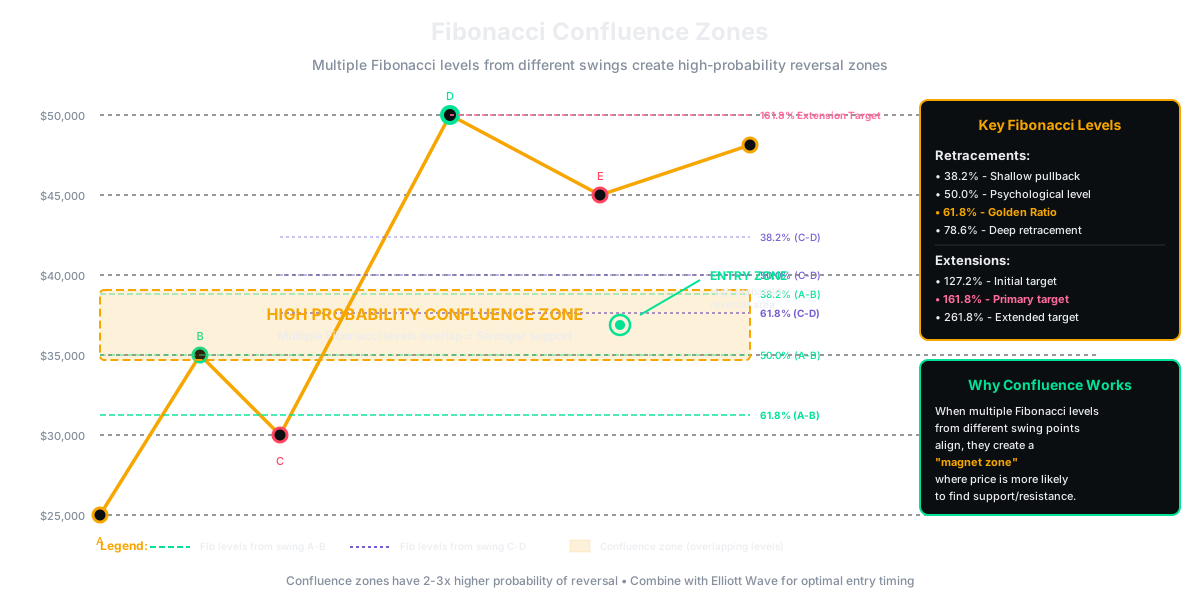
Fibonacci ratios are mathematical relationships found throughout nature and financial markets. These levels act as natural support and resistance zones where price action frequently reverses or consolidates.
Key Fibonacci Ratios
Retracement Levels
- 38.2%: Shallow retracement in strong trends
- 50.0%: Psychological midpoint
- 61.8%: Golden ratio, most significant retracement level
- 78.6%: Deep retracement, often signals trend weakness
Extension Levels
- 161.8%: Common target for Wave 3 or impulse moves
- 261.8%: Extended target for strong momentum moves
- 423.6%: Extreme extension in parabolic moves
Integration with Elliott Wave
Fibonacci levels perfectly complement Elliott Wave analysis:
- Wave 2 corrections: Typically retrace 50-61.8% of Wave 1
- Wave 3 targets: Often reach 161.8% extension of Wave 1
- Wave 4 corrections: Usually retrace 38.2% of Wave 3
- Wave C targets: Frequently equal to Wave A or reach 161.8% of Wave A
Disciplined Risk Management
Technical analysis finds opportunities; risk management decides how much each one can cost. The limits below are fixed in advance, not decided trade by trade.
Position Sizing
Per-Trade Risk
We risk no more than 1.5% of the account on any single trade, so a losing streak costs the account in small steps rather than one large loss.
Leverage Control
Crypto exchanges offer high leverage. We cap total leverage across all open positions at 2x, which keeps liquidation prices far from normal market moves.
Stop-Loss Placement
Every trade has a predetermined stop-loss based on technical invalidation levels:
- Elliott Wave invalidation: Beyond the level that would invalidate the wave count
- Fibonacci levels: Below key support or above key resistance
- Market structure: Below swing lows or above swing highs
Profit Targets and Scaling
We use a scaling approach to lock in profits while maintaining exposure to trend continuation:
- First target (50% position): At minimum 2:1 risk/reward ratio
- Second target (25% position): At key Fibonacci extensions or Wave 3 target
- Runner (25% position): Trail stop to capture extended moves
Drawdown Management
Drawdowns are a normal part of trading. Our systematic approach to managing them:
- Every trade has a pre-defined stop-loss based on Elliott Wave structure
- Daily drawdown limit: the day's losses plus the risk on open trades and pending orders are kept within 8% of the account; once that is used up, no new trades open that day
- Position sizing automatically reduces during losing streaks
- Conservative re-entry after a drawdown, to protect the capital that remains
- Account stop level: if the account falls 25% below its starting balance, it stops opening new trades
Adapting to Market Conditions
Not all market conditions are created equal. We adjust our approach based on the current market environment to maximize edge and minimize risk.
Trending Markets
When Elliott Wave patterns show clear impulse structures with extended Wave 3 moves:
- Full position sizing, up to the 1.5% per-trade limit
- Pyramiding: adding to winning positions during pullbacks
- Wider trailing stops to capture full trend
Ranging/Corrective Markets
When Wave 4 corrections or A-B-C patterns dominate:
- Reduced position sizing (1% or less)
- Tighter profit targets at Fibonacci resistance levels
- Increased selectivity, waiting for high-probability setups
High Volatility Environments
During periods of extreme volatility or uncertainty:
- Lower leverage than in calmer markets
- Wider stops beyond noise but tighter position sizing
- Wait for additional confirmation before entries
Bear Markets & Downtrends
When markets enter sustained downtrends, our systematic approach adapts:
- Patient approach: waiting for high-quality A-B-C corrections to complete
- Reduced position sizing (0.5-1% per trade)
- Counter-trend trades only at strong Fibonacci confluence zones (61.8%-78.6%)
- Increased cash allocation during extended bear markets to preserve capital
- Shorting opportunities identified using inverted Elliott Wave patterns
Putting It All Together
Our methodology is a systematic process that combines all these elements into a cohesive trading framework:
1. Market Analysis
Begin with higher timeframe Elliott Wave analysis (4H, Daily) to identify the primary trend and current position within the wave structure.
2. Opportunity Identification
Look for high-probability setups where Elliott Wave and Fibonacci levels align, such as Wave 2 or Wave 4 corrections to key Fibonacci retracement zones.
3. Risk Assessment
Calculate position size based on stop-loss distance and account risk parameters. Determine invalidation level where the Elliott Wave count would be wrong.
4. Entry Execution
Enter positions at Fibonacci retracement levels with limit orders, or on confirmation of trend resumption with market orders.
5. Trade Management
Monitor price action against wave projections and Fibonacci levels. Scale out at predetermined targets, move stops to breakeven after first target, and trail remaining position.
6. Review and Refinement
Every trade is logged and reviewed. We continuously refine our wave counts and adapt to evolving market conditions.
Why We Use This Approach
The approach rests on several elements working together:
- Objective framework: Elliott Wave and Fibonacci give clear, rule-based analysis that limits emotional decision-making
- High-probability setups: We only trade when multiple factors align, to improve the odds of each trade
- Risk management: Strict position sizing and stop-losses limit what a losing period can cost
- Asymmetric risk/reward: We aim for at least 3 units of reward per unit of risk; at that ratio a strategy can stay profitable even if 60% of its trades lose
- Discipline and consistency: Every trade follows the same process, so results reflect the method rather than the mood of the day
Patience, discipline, and systematic execution are what this methodology is built on: established technical analysis combined with strict risk limits. None of this guarantees results. The AI MASTERS record on Bybit shows how the approach has actually performed.
Experience Our Methodology in Action
See how our Elliott Wave and Fibonacci-based approach delivers real results. Start copying our trades on Bybit and benefit from our disciplined methodology.
Start Copying Now